Prevention Dashboard

Dental prevention made visible

🌐 Nederlands
New measurement method · Measurement in two minutes

Making oral health visible

Plaque and bleeding scores recorded in two minutes, displayed in clear charts. Patients who see their own progress change their behaviour. That is what counts.

What does it deliver?

For dentists, dental hygienists, and their patients

Measurement in two minutes

Ten measurement points. Plaque or no plaque, bleeding or no bleeding. Performable by any qualified member of staff, repeatable at every appointment. No special equipment required.

Insight at a glance

Patients see their scores as a trend chart, supplemented by clinical photographs. The moment a patient sees their own chart and asks a question is the beginning of behaviour change.

Task delegation without loss of quality

Measurement and recording by any qualified staff member. The dentist or dental hygienist discusses only the chart. More preventive effect for less time investment per chair.

Measurable results, your own data

Longitudinal scores per patient, trends at a glance. Useful for quality assurance and scientific research into long-term behaviour change.

What it looks like

Click an image for a larger view

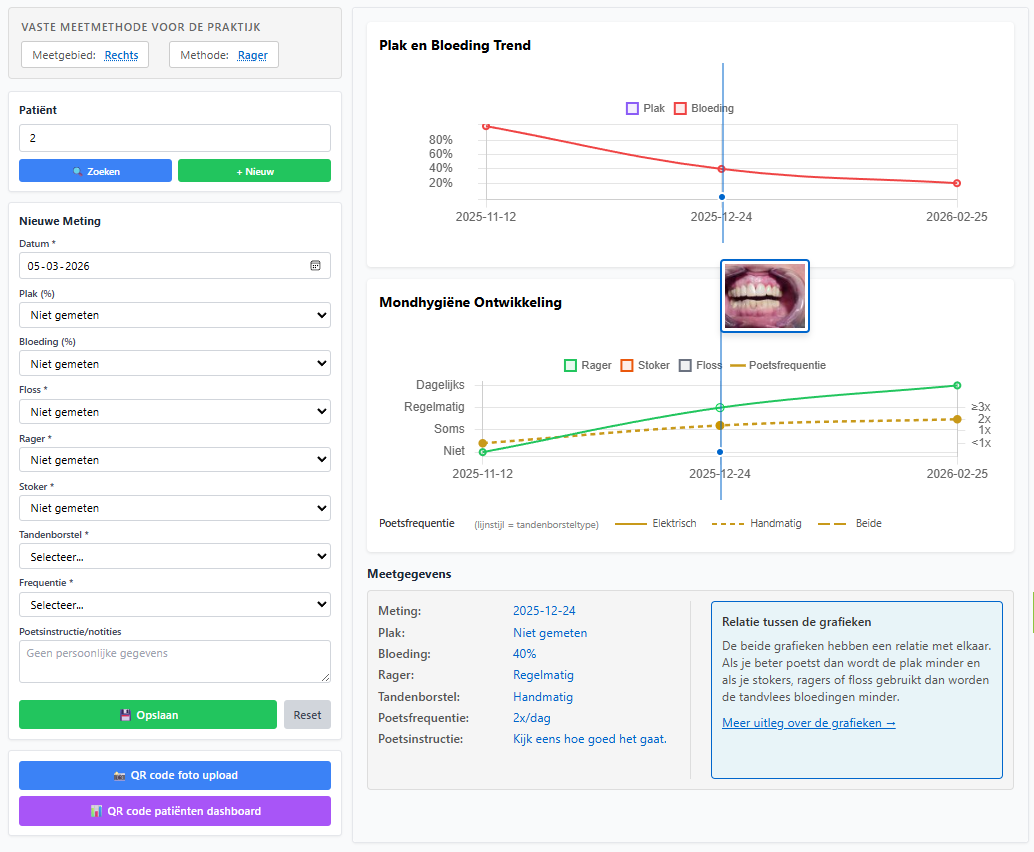
Practice Dashboard — entering plaque and bleeding scores

Practice Dashboard — data entry & charts
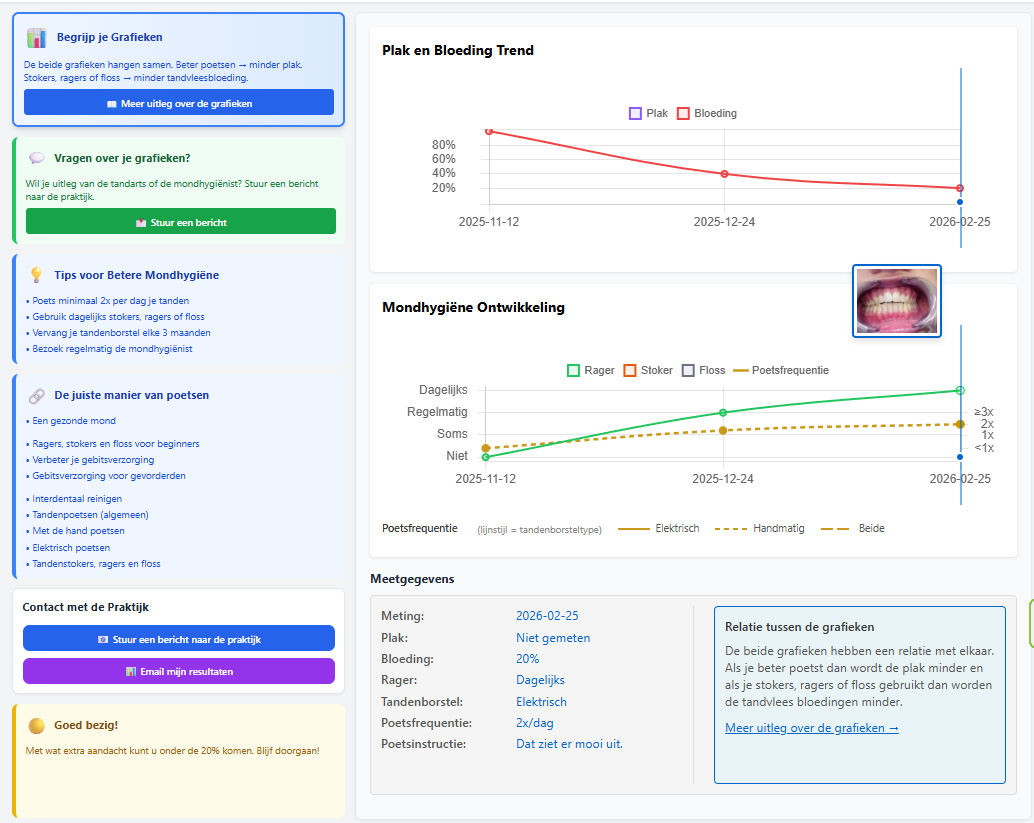
Patient Dashboard — oral health trend charts

Patient Dashboard — patients see their own results

Frequently asked questions

For dentists, dental hygienists, and everyone who wants to know more

Two minutes. Ten measurement points. Plaque or no plaque. Bleeding or no bleeding. Quickly scored chairside. No time-consuming periodontal chart, no special equipment, no extra diary space.
A new measurement method comes with a new index. The Prevention Dashboard uses the Plaque Awareness Index (PAI) and the Papillary Bleeding Awareness Index (PBAI). Both indices are based on ten dichotomous measurement points and immediately produce a percentage between 0 and 100. Simple, repeatable, and suitable for use by any member of staff.
Any member of staff in the practice who is authorised and competent. The method has been deliberately kept simple so that task delegation is possible. This frees up your time as a clinician for the conversation that follows from the chart.
Yes. Patients who see their own chart ask questions more often and adjust their behaviour more often than patients who only receive verbal instruction. Visible evidence works better than words. The patient decides for themselves whether and how they change.
The first year costs €50 flat. After that, €0.50 per active patient per year, with a minimum of €50. You only pay for what you actually use.
Yes. We store only the minimum necessary data, no personal identification details. Data is encrypted. The full GDPR accountability statement is in our privacy policy.
A short introductory course is required before the start. This covers, among other things, the measurement method, the interpretation of charts, and the conversation approach that fits this system.